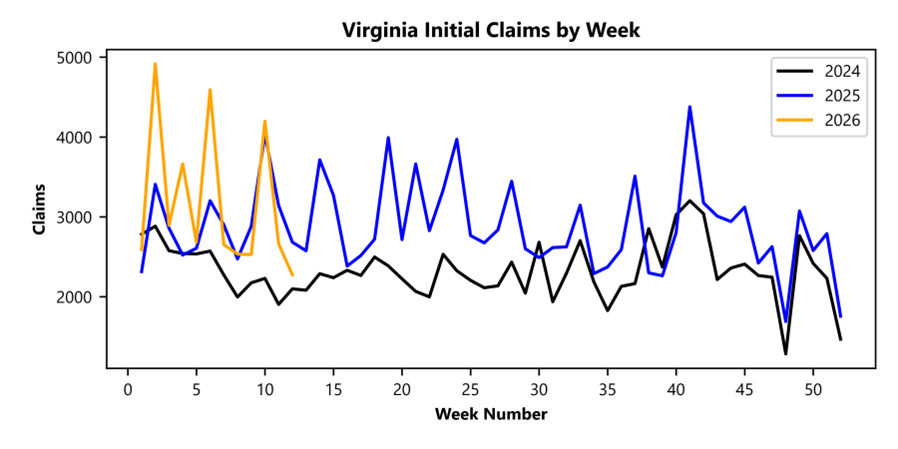
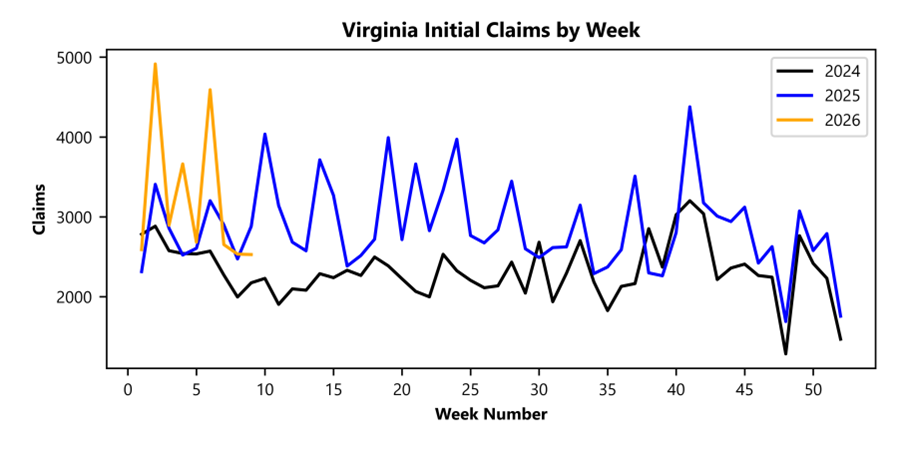
RICHMOND— Virginia Works’ Economic Information and Analytics Division, which serves as the Commonwealth’s official source for labor market and workforce data, reported that that 2,274 unemployment insurance weekly initial claims were filed during the week ending March 21, 2026. The claims were filed with the Virginia Employment Commission, which administers the Commonwealth’s Unemployment Insurance program. This is 14.6 percent lower than last week’s 2,662 claims and 15.2 percent lower than the comparable week of last year (2,683). Nearly 78 percent of claimants self-reported an employer which correlates to an associated industry. Based on this reporting, the top five industries (58 percent) were Professional, Scientific, and Technical Services (276); Administrative and Support and Waste Management (196); Health Care and Social Assistance (188); Retail Trade (167); and Manufacturing (153).
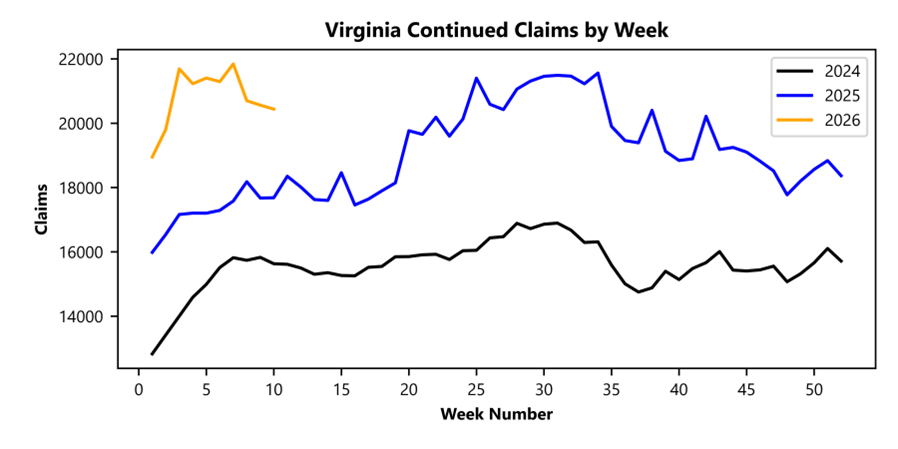
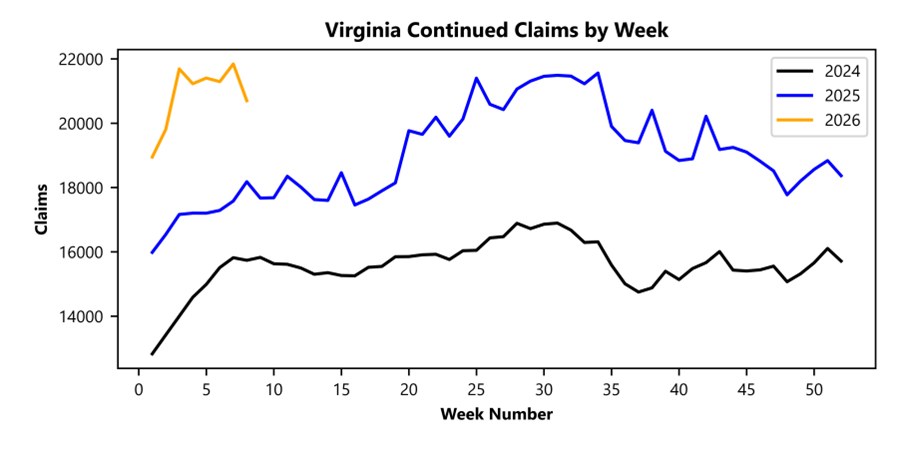
Continued weeks’ claims (20,592) were 4.3 percent lower than last week (21,511) and were 14.3 percent higher than the comparable week of last year (18,013). Nearly 92 percent of claimants self-reported an employer which correlates to an associated industry. Based on this reporting, the top five industries (59 percent) were Professional, Scientific, and Technical Services (3,935); Administrative and Support and Waste Management (2,284); Manufacturing (1,852); Health Care and Social Assistance (1,739); and Retail Trade (1,468).
Significant Layoffs and Announcements are available at the following websites:
WARN Notices | Virginia Works
Announcements | Virginia Economic Development Partnership
|
Unemployment
Claims Activity Comparison
|
|
|
Week
Ending
03/21/2026
|
Week
Ending
03/14/2026
|
Week
Ending
03/07/2026
|
Last
Year
03/22/2025
|
|
Initial
Claims
|
2,274
|
2,662
|
4,198
|
2,683
|
|
Initial Change (%)
|
-388 (-14.6%)
|
-1,536 (-36.6%)
|
+1,670 (+66.1%)
|
-409 (-15.2%)
|
|
Continued
Claims
|
20,592
|
21,511
|
20,437
|
18,013
|
|
Continued
Change (%)
|
-919 (-4.3%)
|
+1,074 (+5.3%)
|
-123 (-0.6%)
|
+2,579 (+14.3%)
|
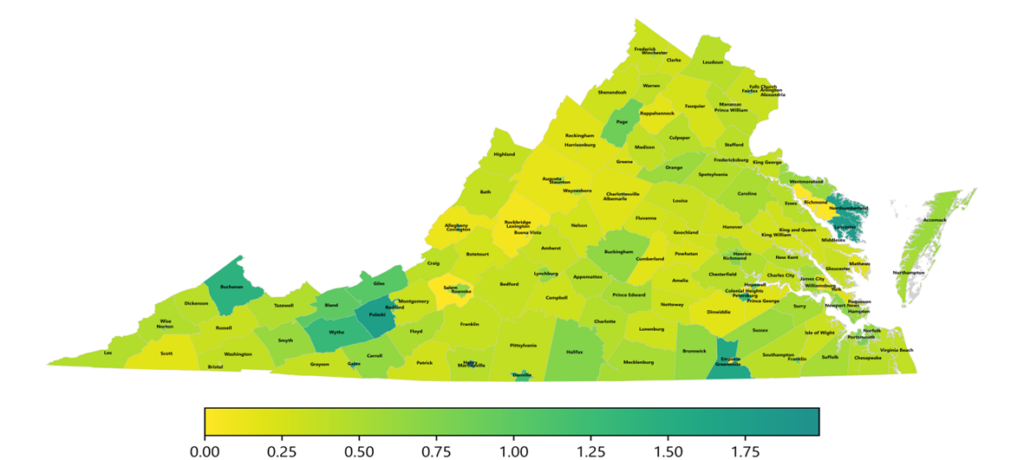
Virginia Continued Weeks Claimed as a Percentage of Total Workforce
A person who has already filed an initial claim and who has experienced a week of unemployment files a continued claim to claim benefits for that week of unemployment. On a weekly basis, continued claims reflect a good approximation of the current number of insured unemployed workers filing for UI benefits, and are a good indicator of labor market conditions. While continued claims are not a leading indicator, they provide confirming evidence of the direction of the economy.
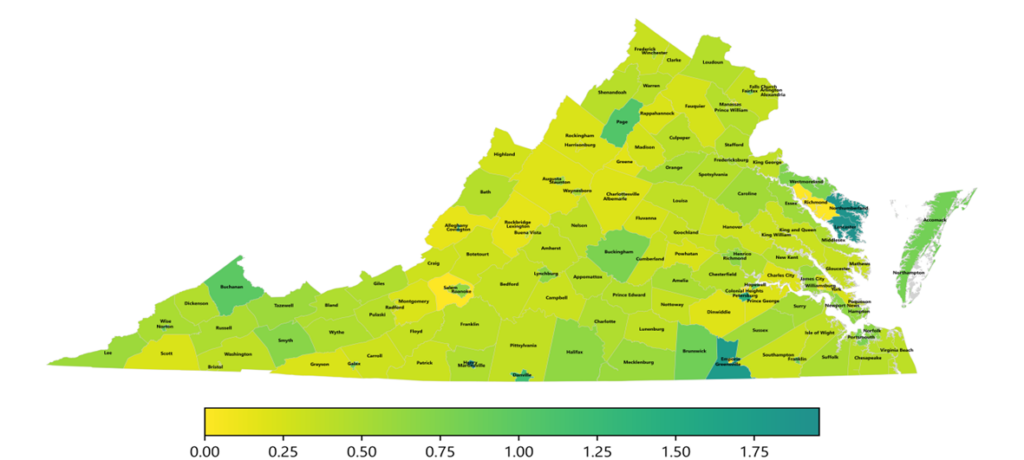
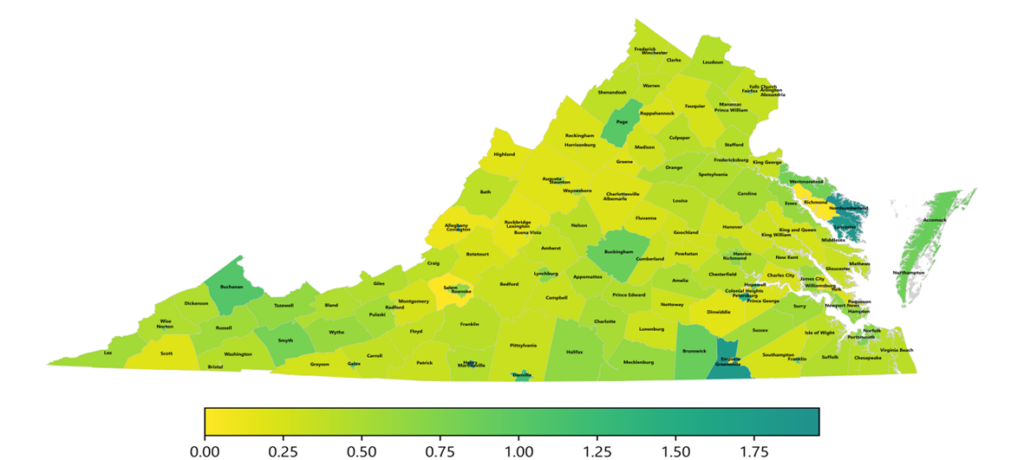
The color-coded map below shows the distribution of this week’s continued claims in Virginia’s counties and cities, expressed as a percentage of each locality’s labor force. This approach provides a more meaningful comparison across areas by adjusting for differences in labor force size. Yellow represents a lower percentage of continued claims relative to the labor force, while progressively darker shades transitioning from yellow to green and dark green indicate higher percentages. The legend at the bottom shows the color spectrum and its corresponding percentage ranges.
Grow with Google is now offering an AI Professional Certificate for free to those signed up with Coursera.
Coursera Link and more information on the program on Google’s Site
Visit the VirginiaHasJobs AI website for more information
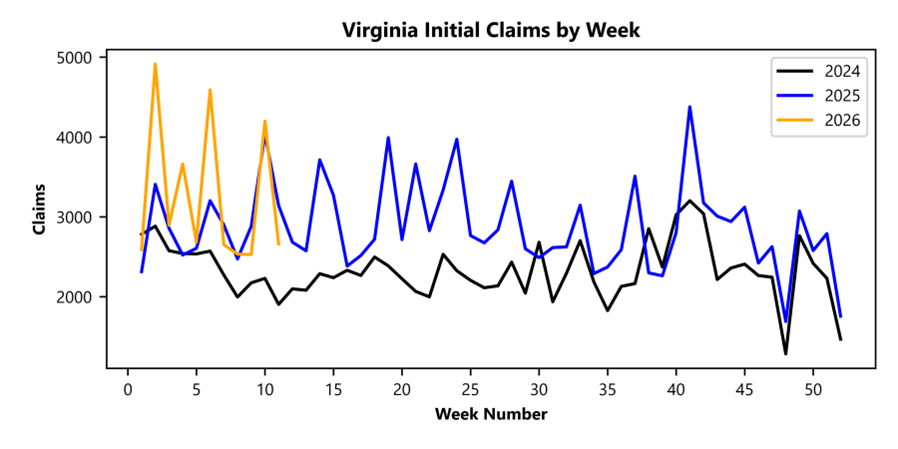
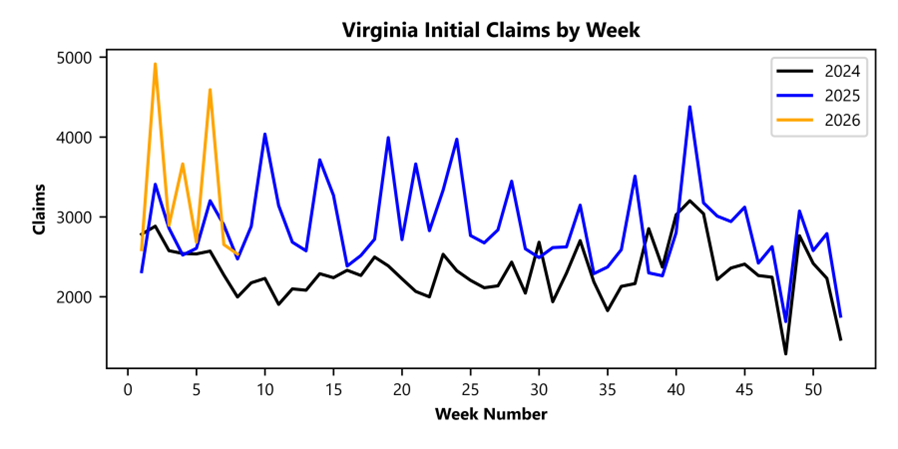
RICHMOND— Virginia Works’ Economic Information and Analytics Division, which serves as the Commonwealth’s official source for labor market and workforce data, reported that that 2,662 unemployment insurance weekly initial claims were filed during the week ending March 14, 2026. The claims were filed with the Virginia Employment Commission, which administers the Commonwealth’s Unemployment Insurance program. This is 36.6 percent lower than last week’s 4,198 claims and 15.2 percent lower than the comparable week of last year (3,141). Nearly 80 percent of claimants self-reported an employer which correlates to an associated industry. Based on this reporting, the top five industries (62 percent) were Professional, Scientific, and Technical Services (344); Manufacturing (297); Health Care and Social Assistance (237); Administrative and Support and Waste Management (210); and Retail Trade (185).
Continued weeks’ claims (21,511) were 5.3 percent higher than last week (20,437) and were 17.2 percent higher than the comparable week of last year (18,349). Nearly 92 percent of claimants self-reported an employer which correlates to an associated industry. Based on this reporting, the top five industries (60 percent) were Professional, Scientific, and Technical Services (3,954); Administrative and Support and Waste Management (2,390); Manufacturing (2,340); Health Care and Social Assistance (1,646); and Construction (1,510).
Significant Layoffs and Announcements are available at the following websites:
WARN Notices | Virginia Works
Announcements | Virginia Economic Development Partnership
|
Unemployment
Claims Activity Comparison
|
|
|
Week
Ending
03/14/2026
|
Week
Ending
03/07/2026
|
Week
Ending
02/28/2026
|
Last
Year
03/15/2025
|
|
Initial
Claims
|
2,662
|
4,198
|
2,528
|
3,141
|
|
Initial Change (%)
|
-1,536 (-36.6%)
|
+1,670 (+66.1%)
|
-5 (-0.2%)
|
-479 (-15.2%)
|
|
Continued
Claims
|
21,511
|
20,437
|
20,560
|
18,349
|
|
Continued
Change (%)
|
+1,074 (+5.3%)
|
-123 (-0.6%)
|
-138 (-0.7%)
|
+3,162 (+17.2%)
|
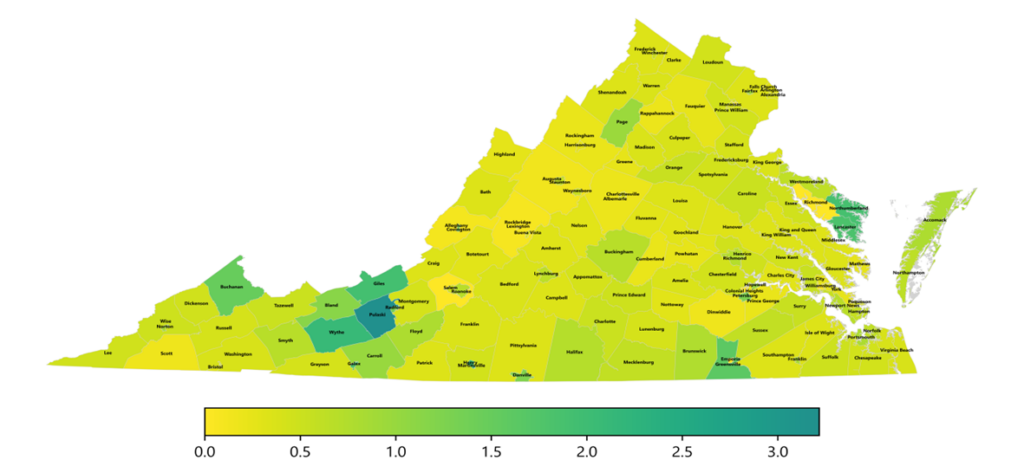
Virginia Continued Weeks Claimed as a Percentage of Total Workforce
A person who has already filed an initial claim and who has experienced a week of unemployment files a continued claim to claim benefits for that week of unemployment. On a weekly basis, continued claims reflect a good approximation of the current number of insured unemployed workers filing for UI benefits, and are a good indicator of labor market conditions. While continued claims are not a leading indicator, they provide confirming evidence of the direction of the economy.
The color-coded map below shows the distribution of this week’s continued claims in Virginia’s counties and cities, expressed as a percentage of each locality’s labor force. This approach provides a more meaningful comparison across areas by adjusting for differences in labor force size. Yellow represents a lower percentage of continued claims relative to the labor force, while progressively darker shades transitioning from yellow to green and dark green indicate higher percentages. The legend at the bottom shows the color spectrum and its corresponding percentage ranges.
Richmond, VA – Governor Abigail Spanberger’s office has announced key leadership appointments at Virginia Works, the Commonwealth’s Department of Workforce Development and Advancement. Commissioner Nicole Overley has been reappointed to lead the agency, joined by two senior officials: Nicholas Toth as Deputy Commissioner for Policy and Strategy and Dana Westgren as Senior Policy Advisor.
“I am grateful for the Governor’s confidence and am honored to continue serving the Commonwealth,” said Commissioner Overley. “In addition, Nicholas Toth and Dana Westgren bring exceptional experience in workforce development and public service. Their leadership will support our mission to strengthen Virginia’s talent pipeline and expand opportunities for workers and employers across the Commonwealth.”
Secretary of Labor Jessica Looman underscored the significance of the appointments. “These leaders bring substantial experience in workforce development at the state and national levels,” said Secretary Looman. “Their combined expertise will support Virginia Works as it advances innovative strategies that improve access to high‑quality careers for Virginians and help our employers meet essential talent needs.”
Nicholas Toth, Deputy Commissioner for Policy and Strategy, is a career-long public servant with extensive experience in state and federal workforce policy. He most recently served as Advisor to the New Jersey Labor Commissioner, providing strategic guidance on statewide workforce development, economic policy, and enforcement initiatives. His prior roles include Deputy Assistant Commissioner for New Jersey’s Division of Workforce Development and founding State Director of the New Jersey Office of Apprenticeship, where he oversaw substantial expansion of apprenticeship opportunities. At the federal level, he served as Special Assistant to the U.S. Secretary of Labor and as a Policy Advisor in the Office of the Assistant Secretary for Policy. Toth holds both a Bachelor and Master’s degree from Cornell University and a Master in Public Policy from Princeton University.
Dana Westgren, Senior Policy Advisor, brings ten years of workforce policy experience across federal, nonprofit, and state-focused organizations. Most recently, she served at the Corporation for a Skilled Workforce, supporting national workforce initiatives. Her prior service at the U.S. Department of Labor’s Employment and Training Administration included data and policy leadership within the Workforce Innovation and Opportunity Act (WIOA) program office and serving as Unit Chief for WIOA governance. Westgren specializes in using outcomes data to inform policy and expand access to high‑quality employment opportunities, particularly for underserved populations. She previously worked at the National Governors Association and as a Job Developer with Academy of Hope in Washington, DC. She holds a Bachelor of Science in Management and Marketing from the University of Illinois Urbana‑Champaign and a Master of Public Administration from the Cornell Brooks School of Public Policy.
Nicole Overley has served as Commissioner of Virginia Works since September 2024. Under her leadership, Virginia Works has delivered measurable results for the Commonwealth while building the infrastructure for long-term impact. In 2025, Virginia Works placed over 20,000 Virginians into jobs, supported more than 3,500 returning citizens with career coaching, and earned Virginia the #1 national ranking in active programs and employer sponsors among state apprenticeship agencies, all while implementing internal process modernizations, technology enhancements, and talent development initiatives that have built a high-performing, responsive agency ready to serve Virginians at every point in their workforce journeys. Commissioner Overley joined Virginia Works with more than a decade of experience at Deloitte Consulting, where she established and scaled the firm’s Future of Work practice for government, higher education, and nonprofits and was named to Consulting Magazine’s “35 under 35” and was given Deloitte’s “Good, Good, Good” award for responsible leadership and public sector impact. She holds two degrees from Johns Hopkins University, and her combination of private-sector innovation and public-sector expertise continues to guide Virginia Works’ approach: workforce strategy grounded in execution, and outcomes grounded in people.
###
Virginia Works, the Commonwealth’s Department of Workforce Development and Advancement, is dedicated to serving both job seekers and employers with a wide range of workforce services and talent strategies. Virginia Works is an equal opportunity employer. Auxiliary aids and services are available upon request to individuals with disabilities. VRC/TDD VA Relay 711.
RICHMOND— Virginia Works’ Economic Information and Analytics Division, which serves as the Commonwealth’s official source for labor market and workforce data, reported that that 4,198 unemployment insurance weekly initial claims were filed during the week ending March 07, 2026. The claims were filed with the Virginia Employment Commission, which administers the Commonwealth’s Unemployment Insurance program. This is 66.1 percent higher than last week’s 2,528 claims and 4.0 percent higher than the comparable week of last year (4,036). Nearly 77 percent of claimants self-reported an employer which correlates to an associated industry. Based on this reporting, the top five industries (73 percent) were Manufacturing (1,258); Professional, Scientific, and Technical Services (369); Administrative and Support and Waste Management (244); Retail Trade (226); and Health Care and Social Assistance (197).
Continued weeks’ claims (20,437) were 0.6 percent lower than last week (20,560) and were 15.6 percent higher than the comparable week of last year (17,681). Nearly 92 percent of claimants self-reported an employer which correlates to an associated industry. Based on this reporting, the top five industries (59 percent) were Professional, Scientific, and Technical Services (3,978); Administrative and Support and Waste Management (2,443); Health Care and Social Assistance (1,689); Construction (1,611); and Retail Trade (1,457).
Significant Layoffs and Announcements are available at the following websites:
WARN Notices | Virginia Works
Announcements | Virginia Economic Development Partnership
|
Unemployment
Claims Activity Comparison
|
|
|
Week
Ending
03/07/2026
|
Week
Ending
02/28/2026
|
Week
Ending
02/21/2026
|
Last
Year
03/08/2025
|
|
Initial
Claims
|
4,198
|
2,528
|
2,533
|
4,036
|
|
Initial Change (%)
|
+1,670 (+66.1%)
|
-5 (-0.2%)
|
-120 (-4.5%)
|
+162 (+4.0%)
|
|
Continued
Claims
|
20,437
|
20,560
|
20,698
|
17,681
|
|
Continued
Change (%)
|
-123 (-0.6%)
|
-138 (-0.7%)
|
-1,143 (-5.2%)
|
+2,756 (+15.6%)
|
Virginia Continued Weeks Claimed as a Percentage of Total Workforce
A person who has already filed an initial claim and who has experienced a week of unemployment files a continued claim to claim benefits for that week of unemployment. On a weekly basis, continued claims reflect a good approximation of the current number of insured unemployed workers filing for UI benefits, and are a good indicator of labor market conditions. While continued claims are not a leading indicator, they provide confirming evidence of the direction of the economy.
The color-coded map below shows the distribution of this week’s continued claims in Virginia’s counties and cities, expressed as a percentage of each locality’s labor force. This approach provides a more meaningful comparison across areas by adjusting for differences in labor force size. Yellow represents a lower percentage of continued claims relative to the labor force, while progressively darker shades transitioning from yellow to green and dark green indicate higher percentages. The legend at the bottom shows the color spectrum and its corresponding percentage ranges.
RICHMOND— Virginia Works’ Economic Information and Analytics Division, which serves as the Commonwealth’s official source for labor market and workforce data, reported that that 2,528 unemployment insurance weekly initial claims were filed during the week ending February 28, 2026. The claims were filed with the Virginia Employment Commission, which administers the Commonwealth’s Unemployment Insurance program. This is 0.2 percent lower than last week’s 2,533 claims and 12.3 percent lower than the comparable week of last year (2,881). Nearly 82 percent of claimants self-reported an employer which correlates to an associated industry. Based on this reporting, the top five industries (56 percent) were Professional, Scientific, and Technical Services (328); Health Care and Social Assistance (233); Administrative and Support and Waste Management (203); Retail Trade (183); and Manufacturing (158).
Continued weeks’ claims (20,560) were 0.7 percent lower than last week (20,698) and were 16.3 percent higher than the comparable week of last year (17,671). Nearly 92 percent of claimants self-reported an employer which correlates to an associated industry. Based on this reporting, the top five industries (60 percent) were Professional, Scientific, and Technical Services (4,003); Administrative and Support and Waste Management (2,484); Construction (1,709); Health Care and Social Assistance (1,681); and Retail Trade (1,468).
Significant Layoffs and Announcements are available at the following websites:
WARN Notices | Virginia Works
Announcements | Virginia Economic Development Partnership
|
Unemployment
Claims Activity Comparison
|
|
|
Week
Ending
02/28/2026
|
Week
Ending
02/21/2026
|
Week
Ending
02/14/2026
|
Last
Year
03/01/2025
|
|
Initial
Claims
|
2,528
|
2,533
|
2,653
|
2,881
|
|
Initial Change (%)
|
-5 (-0.2%)
|
-120 (-4.5%)
|
-1,939 (-42.2%)
|
-353 (-12.3%)
|
|
Continued
Claims
|
20,560
|
20,698
|
21,841
|
17,671
|
|
Continued
Change (%)
|
-138 (-0.7%)
|
-1,143 (-5.2%)
|
+550 (+2.6%)
|
+2,889 (+16.3%)
|
Virginia Continued Weeks Claimed as a Percentage of Total Workforce
A person who has already filed an initial claim and who has experienced a week of unemployment files a continued claim to claim benefits for that week of unemployment. On a weekly basis, continued claims reflect a good approximation of the current number of insured unemployed workers filing for UI benefits, and are a good indicator of labor market conditions. While continued claims are not a leading indicator, they provide confirming evidence of the direction of the economy.
The color-coded map below shows the distribution of this week’s continued claims in Virginia’s counties and cities, expressed as a percentage of each locality’s labor force. This approach provides a more meaningful comparison across areas by adjusting for differences in labor force size. Yellow represents a lower percentage of continued claims relative to the labor force, while progressively darker shades transitioning from yellow to green and dark green indicate higher percentages. The legend at the bottom shows the color spectrum and its corresponding percentage ranges.
RICHMOND – Virginia Works’ Economic Information and Analytics Division, which serves as the Commonwealth’s official source for labor market and workforce data, reported that that 2,533 unemployment insurance weekly initial claims were filed during the week ending February 21, 2026. The claims were filed with the Virginia Employment Commission, which administers the Commonwealth’s Unemployment Insurance program. This is 4.5 percent lower than last week’s 2,653 claims and 2.4 percent higher than the comparable week of last year (2,473). Nearly 79 percent of claimants self-reported an employer which correlates to an associated industry.
Based on this reporting, the top five industries (57 percent) were Professional, Scientific, and Technical Services (307); Administrative and Support and Waste Management (222); Health Care and Social Assistance (205); Retail Trade (203); and Accommodation and Food Services (164).
Continued weeks’ claims (20,698) were 5.2 percent lower than last week (21,841) and were 13.9 percent higher than the comparable week of last year (18,179). Nearly 92 percent of claimants self-reported an employer which correlates to an associated industry.
Based on this reporting, the top five industries (60 percent) were Professional, Scientific, and Technical Services (4,079); Administrative and Support and Waste Management (2,501); Construction (1,725); Health Care and Social Assistance (1,692); and Retail Trade (1,454).
Significant Layoffs and Announcements are available at the following websites:
WARN Notices | Virginia Works
Announcements | Virginia Economic Development Partnership
|
Unemployment
Claims Activity Comparison
|
|
|
Week
Ending
02/21/2026
|
Week
Ending
02/14/2026
|
Week
Ending
02/07/2026
|
Last
Year
02/22/2025
|
|
Initial
Claims
|
2,533
|
2,653
|
4,592
|
2,473
|
|
Initial Change (%)
|
-120 (-4.5%)
|
-1,939 (-42.2%)
|
+1,909 (+71.2%)
|
+60 (+2.4%)
|
|
Continued
Claims
|
20,698
|
21,841
|
21,291
|
18,179
|
|
Continued
Change (%)
|
-1,143 (-5.2%)
|
+550 (+2.6%)
|
-112 (-0.5%)
|
+2,519 (+13.9%)
|
Virginia Continued Weeks Claimed as a Percentage of Total Workforce
A person who has already filed an initial claim and who has experienced a week of unemployment files a continued claim to claim benefits for that week of unemployment. On a weekly basis, continued claims reflect a good approximation of the current number of insured unemployed workers filing for UI benefits, and are a good indicator of labor market conditions. While continued claims are not a leading indicator, they provide confirming evidence of the direction of the economy.
The color-coded map below shows the distribution of this week’s continued claims in Virginia’s counties and cities, expressed as a percentage of each locality’s labor force. This approach provides a more meaningful comparison across areas by adjusting for differences in labor force size. Yellow represents a lower percentage of continued claims relative to the labor force, while progressively darker shades transitioning from yellow to green and dark green indicate higher percentages. The legend at the bottom shows the color spectrum and its corresponding percentage ranges.
RICHMOND Virginia Works (the
Virginia Department of Workforce Development and Advancement) announced today
that the U.S. Bureau of Labor Statistics (BLS) December 2025 Job Openings and
Labor Turnover Survey (JOLTS) reports lower numbers of layoffs and discharges.
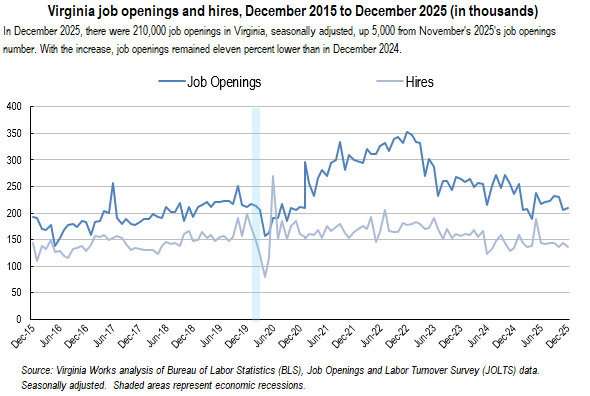
On
the last business day in December, there were 210,000 job openings in
Virginia, seasonally adjusted, an increase of 5,000 from November s revised figure.
Job openings were eleven percent lower than December 2024 s figure. Nationwide,
the number of job openings trended down to 6.5 million (-386,000) in December
and was down by 966,000 over the year. The number of job openings decreased in
professional and business services (-257,000), retail trade (-195,000), and
finance and insurance (-120,000). Nationwide, the job openings rate was 3.9
percent.
The
number of hires in Virginia was 136,000 in December, an 8,000 decrease
from November s figure but, essentially, unchanged over the year. JOLTS defines
hires as all additions to the payroll during the month. In December, the
number of U.S. hires was little changed at 5.3 million. The number of hires
increased in real estate
and
rental and leasing (+38,000) and in state and local government, excluding
education (+36,000). Hires decreased in federal government (-11,000). The U.S.
rate of hires nationwide was little changed at 3.3 percent.
The
Virginia hires‑per‑job‑opening (HPJO) ratio remained
steady in December at two hires for every three job openings. This
metric reflects the pace of hiring relative to available positions and serves
as a proxy for the time it takes employers to fill vacancies. Also in December,
the unemployed-per-job-opening ratio was eight unemployed individuals for every
ten job openings in Virginia, compared to the national ratio of eleven
unemployed for every ten job openings.
Total
job
separations in Virginia fell to 145,000, 17,000 lower
over the month. Nationwide, total job separations in December were little
changed at 5.3 million. The Virginia total separations rate fell
to 3.4 percent. Nationwide, the total separations rate remained little changed
at 3.3 percent. The number of total separations decreased in professional and
business services (-212,000) and in private educational services (-20,000).
Total separations increased in transportation, warehousing, and utilities
(+110,000) and in federal government (+10,000).
An
estimated 90,000 workers quit jobs ( quits ) from Virginia employers in December.
Nationwide, the number of quits was unchanged at 3.2 million. The number of
quits decreased in professional and business services (-151,000) and in private
educational services (-19,000). Quits increased in retail trade (+87,000) and
in
information
(+28,000). The quits rate in the Commonwealth was little changed at 2.1
percent. Over the month, the U.S. quits rate was little changed at 2.0 percent.
The December churn rate (the sum of
the hires and total separations rates) in Virginia decreased by 0.6 points from
November s revised figure to 6.6 percent and was driven
by decreases in hires, job quits, and layoffs. It equaled the U.S. churn rate,
which was little changed over the month.
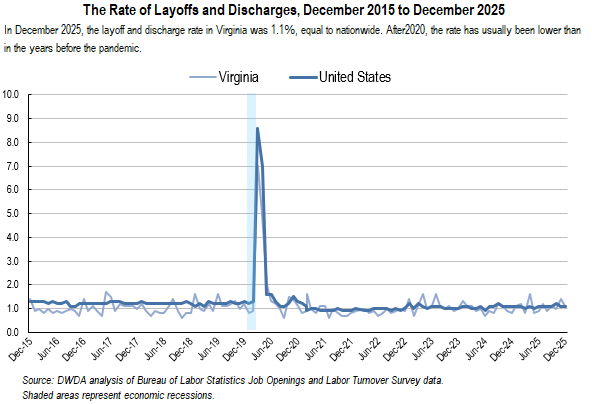
The
number of layoffs and discharges in Virginia was 47,000 in December, a decrease
of 13,000 from November s estimate. The number of U.S. layoffs and discharges
in December was little changed at 1.8 million. The layoffs and discharges rate
was unchanged at 1.1 percent. Layoffs and discharges increased in
transportation, warehousing, and utilities (+103,000) but decreased in finance
and insurance (-20,000). The Virginia layoffs and discharges rate fell
to 1.1 percent. In December, the U.S. rate of layoffs and discharges was little
changed at 1.1 percent.
On
the last business day of December, JOLTS data indicated the number of Layoffs
and Discharges decreased to 47,000. While this was nearly 40 percent higher
than in December 2024, recent years figures remained, on the whole, within the
range seen over the last decade.
BLS s
JOLTS data provides information on all the components that make up the net
change in the number of jobs over a month, including job openings, hires,
layoffs, voluntary quits, and other job separations (including retirements and
worker deaths). Together, these components attempt to reveal the overall change
in payroll employment. JOLTS data is seasonally adjusted and describes
conditions on the last business day of the month. The current month s data is
preliminary and the previous month s data has been revised.
|
Job Openings
Job openings include all positions that
are open on the last business day of the reference month. A job is open only
if it meets the following three conditions: (1) A specific position exists
and there is work available for that position; the position can be full time
or part time, and it can be permanent, short term, or seasonal; (2) the job
could start within 30 days, whether or not the employer can find a suitable
candidate during that time; and (3) the employer is actively recruiting
workers from outside the establishment to fill the position. Excluded are
positions open only to internal transfers, promotions or demotions, or
recalls from layoffs.
Hires
Hires include all additions to the payroll
during the entire reference month, including newly hired and rehired
employees; full-time and part-time employees; permanent, short-term, and
seasonal employees; employees who were recalled to a job at the location
following a layoff (formal suspension from pay status) lasting more than 7
days; on-call or intermittent employees who returned to work after having
been formally separated; workers who were hired and separated during the
month; and transfers from other locations. Excluded are transfers or
promotions within the reporting location, employees returning from a strike,
and employees of temporary help agencies, employee leasing companies, outside
contractors, or consultants.
Separations
Separations include all separations from
the payroll during the entire reference month and are reported by type of
separation: quits, layoffs and discharges, and other separations. Quits
include employees who leave voluntarily, except for retirements or transfers
to other locations. Layoffs and discharges include involuntary separations
initiated by the employer, including layoffs with no intent to rehire;
layoffs (formal suspensions from pay status) lasting or expected to last more
than 7 days; discharges resulting from mergers, downsizing, or closings;
firings or other discharges for cause; terminations of permanent or
short-term employees; and terminations of seasonal employees (whether or not
they are expected to return the next season). Other separations include
retirements, transfers to other locations, separations due to employee
disability, and deaths. Excluded are transfers within the same location,
employees on strike, and employees of temporary help agencies, employee
leasing companies, outside contractors, or consultants.
*Excerpted from U.S. Bureau of Labor
Statistics, Handbook of Methods, "Job Openings and Labor Turnover
Survey: Concepts," https://www.bls.gov/opub/hom/jlt/concepts.htm.
|
NOTICE: The State Job
Openings and Labor Turnover news release will move from a monthly news release
to an annual news release, according to a BLS announcement. The State Job
Openings and Labor Turnover news release will move from a monthly news release
to an annual news release. The first annual news release will be in July 2026.
Going forward, monthly estimates for the prior calendar year will be published
each year along with the annual news release. The annual news release will
incorporate benchmark revisions to JOLTS national estimates, updated Current
Employment Statistics (CES) employment estimates, and updated Quarterly Census
of Employment and Wages (QCEW) data. Data for all states and the U.S. will be
available on the BLS website JOLTS page, at https://www.bls.gov/jlt/.